Advanced features
Explore the full capabilities of your site data.
A complete breakdown of tools & features.
Accuracy & verification
- Ground control checkpoint QA
- Import RTK rover shots by paste or CSV, see each one pinned on the scan, and get per-point residuals: known elevation vs. scanned surface, delta, and pass/fail against a tolerance you set. Reports vertical RMSE and flags when the dataset meets 3 cm vertical or better.
- Accuracy statement in reports
- Checkpoint results attach to generated reports, so deliverables carry their own proof.
- True coordinate systems
- Every scan lives in its real projection (state plane or UTM, EPSG-coded). Coordinates, exports, and measurements are all in the native CRS, not arbitrary local space.
- Exact unit handling
- One-click toggle between US survey feet and meters. Measurements convert exactly and the underlying data is never resampled.
Measurement suite
- Point
- Drop a pin, get easting, northing, and elevation.
- Distance
- 3D slope length, horizontal distance, elevation change, and grade percentage along a multi-point path.
- Area
- Planimetric area plus perimeter for any polygon.
- Height
- Two-click elevation difference with horizontal offset.
- Angle
- Three-point angle measurement.
- Volume / stockpile
- Outline a pile, get net volume, cut, fill, footprint area, and the base-plane method used (lowest vertex or least-squares mean plane), with sampled-cell counts for auditability.
- Automatic stockpile detection
- One click outlines every pile toe on the site and computes each volume.
- Set on ground
- Snap any measurement's points to the terrain surface.
- Pinned notes
- Annotations anchored to real locations in the scan, with fly-to.
Terrain analysis
- Custom contours
- Generated on demand at any interval, with elevation labels, configurable colors and line weights, and the option to restrict them to a drawn analysis area.
- Water flow simulation
- Set a rainfall depth and watch animated streamlines and directional arrows trace drainage across the site, with ponding-depth visualization.
- Basin / low-point report
- A table of every depression: location, depth, and ponding volume.
- Slope heatmap
- Instant steepness overlay across the whole site.
- Elevation profile
- Cut a section line and get the ground profile along it.
- Elevation color modes
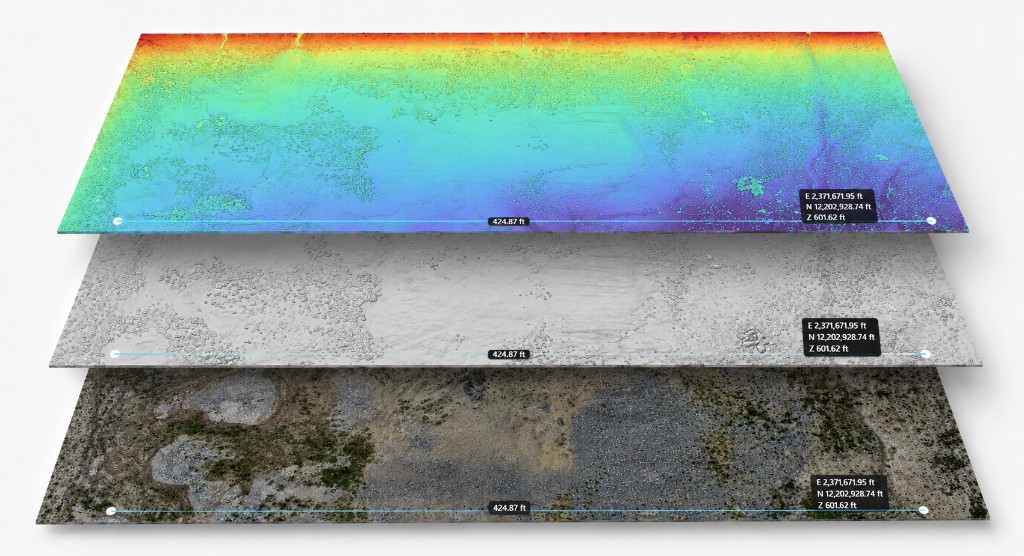
- Height ramp, intensity, classification, and bare-earth views alongside true-color RGB.
- Analysis areas
- Draw a polygon to scope contours and hydrology to just the region that matters.
Design & change
- Design surface overlay
- Import a design (DXF 3D faces or LandXML TIN) and compute cut and fill to design directly against the scan.
- Change detection
- Compare two scans of the same site and see the differences as a heatmap: what was added, removed, or regraded between visits.
- CAD/GIS overlays
- Drape DWG (server-converted), DXF, KML, and GeoJSON over the scan, with an alignment tool for fine-tuning fit.
CAD-ready deliverables
- DEM GeoTIFF
- Float32 elevation model that opens at true coordinates in QGIS, ArcGIS, and Civil 3D.
- LandXML 1.2 TIN
- Imports as a surface in Civil 3D, Trimble Business Center, and Carlson.
- PNEZD point grid CSV
- The format survey crews actually use: point, northing, easting, elevation, description.
- Measurement exports
- CSV, DXF (CAD, native CRS), GeoJSON (GIS), and KML (Google Earth and Land id).
- Original source files
- Clients can download the raw deliverables you attach to the project.
Viewing & presentation
- Massive point clouds, streamed
- 160-million-point scans open in seconds in a browser. Detail streams in as you move, served from a global CDN.
- Three data types in one viewer
- Classified point clouds, textured 3D meshes, and Gaussian-splat photorealistic captures, plus orthomosaic and DTM drapes.
- Works on phones and tablets
- Adaptive rendering tunes itself to the device, with automatic recovery if the mobile GPU taps out.
- Compass and plan view
- An always-on north indicator (click to face grid north) and one-click top-down view.
- Site tours
- Record a camera flythrough, replay it live for a client, or export it as a shareable video.
- Saved views
- Bookmark camera angles anyone can jump back to.
- Site statistics
- Scanned footprint, building and vegetation coverage, elevation range, and average terrain slope computed per scan.
- Snapshot export
- One-click high-res PNG of the current view.
Access & security
- Controlled share links
- Per-link control over which scans are visible and whether measurements and notes show. Presentation mode is view-only.
- Email-verified access codes
- Clients enter a project code plus a one-time passcode sent to a pre-authorized email. Unknown emails are denied.
- Project-scoped everything
- Measurements, notes, checkpoints, and share restrictions are enforced server-side per project and per layer.
Book a scan
Or email contact@strixdynamics.com